Charts with PHP and Google Charts API
Just yesterday I found out about the Google Charts API and I was impressed by this excellent service but noticed that creating multiple charts got pretty messy, especially if I wanted to edit the data later on.
I figured if I wanted to use this in the future, I’d like an easier way to create charts out of my data - thus the class GoogChart was born.
What I wanted to do was to simplify the process of calling the API, say I’ve got my data in an array called $data:
<?php
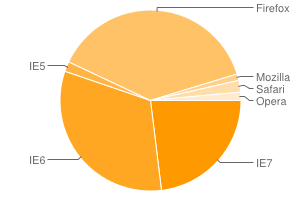
$data = array(
'IE7' => 22,
'IE6' => 30.7,
'IE5' => 1.7,
'Firefox' => 36.5,
'Mozilla' => 1.1,
'Safari' => 2,
'Opera' => 1.4,
);
So I’ve got my data, I want it to be presented as a pie chart and be a specific size as well - Rather than to manually edit this into what the API would accept, as well as adding the labels for each of part of the data - It’s with GoogChart it’s as easy as:
<?php
$chart = new googChart();
$chart->setChartAttrs( array(
    'type' => 'pie',
    'data' => $data,
    'size' => array( 300, 200 )
    ));
echo $chart;
That tiny bit of code generates a Pie chart with all of my data neatly labeled and presented exactly as it should:
But that’s not all it can do, want to add a title to the chart? just add 'title' => 'Browser market 2008' to $chart->setChartAttrs.
GoogChart also supports multiple data types, just add each data to its own array within$data:
<?php
$data = array(
    'February 2008' => array(
        'IE7' => 22,
        'IE6' => 30.7,
        'IE5' => 1.7,
        'Firefox' => 36.5,
        'Mozilla' => 1.1,
        'Safari' => 2,
        'Opera' => 1.4,
    ),
    'January 2008' => array(
        'IE7' => 22,
        'IE6' => 30.7,
        'IE5' => 1.7,
        'Firefox' => 36.5,
        'Mozilla' => 1.1,
        'Safari' => 2,
        'Opera' => 1.4,
    ),
);
The names of each data set are automatically added as Legends.
Supported attributes:
- Type
What kind of chart to create - Title
Chart title - Data
The data to be used in the chart in anarray - Size
The size of the chart(Width x Height) - Color
Colors to be used in the chart asarray - Fill
Fill colors to be used between timelines asarray - Background
Background color of the chart, defaults to#ffffff - LabelsXY
Show or hide X and Y axis labels(true/false)(false by default) - Legend
Show or hide a Legend(true/false)(true by default)
Supported types:
- Pie
Standard pie chart - Line
Standard Line chart - Sparkline
Almost identical to Line, except defaults to no axis lines. - Bar-horizontal
Horizontal bar chart - Bar-vertical
Vertical bar chart
Download
- GoogChart
Includes class as well as a short example file.
Disclaimer
GoogChart covers by no means the whole Google Charts API - only the basics for now.
GoogChart is distributed under the MIT license, so feel free to change the class any way you want.
Special thanks
I’d like to thank my friend Fredrik Holmström for helping me enhance my code.
Enjoy!
Andra inlägg
- Hitta rätt IT-lösningar för ditt företag
- SRE - Vad är det?
- Dags att börja investera
- Nyckeln till förenklade affärer
- Kul fakta om programmering och kodning
- Använd datorn mer
- Vad krävs för att datorn ska fungera?
- Varför måste man ha ett webbhotell?
- Programmering för nybörjare
- Viktigt att göra flyttstädningen rätt